表を見やすくするには、罫線や背景色を整える事が必要です。
罫線や背景色の書式を設定するマクロを用意しておけば、見やすい表を作ることができます。
目次
指定したセルの範囲に罫線を引く
次のようなデータに罫線を引く方法を説明します。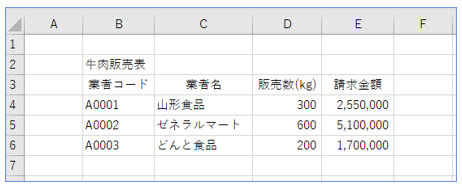
■ BordersプロパティのIndexの種類
[code] Sub サンプル3444_1() Range(“B3:E6”).Select Selection.Borders(xlEdgeTop).LineStyle = xlContinuous Selection.Borders(xlEdgeBottom).LineStyle = xlContinuous Selection.Borders(xlInsideHorizontal).LineStyle = xlDot ActiveWindow.DisplayGridlines = False End Sub [/code]
• Range(“B3:E6”).Select
’セルB3からセルE6を選択します。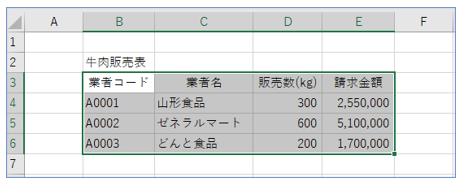
• Selection.Borders(xlEdgeTop).LineStyle = xlContinuous
’上端に実線を引きます。
• Selection.Borders(xlEdgeBottom).LineStyle = xlContinuous
’下端に実線を引きます。
• Selection.Borders(xlInsideHorizontal).LineStyle = xlDot
’行方向に点線を引きます。
• ActiveWindow.DisplayGridlines = False
’表自体の枠線を消します。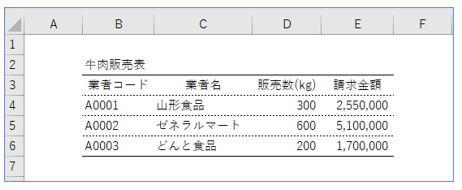
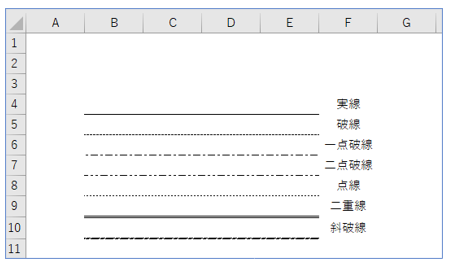
■ LineStyleプロパティの定数の種類
[code] Sub サンプル3444_2() Range(“B3:E3”).Borders(xlEdgeBottom).LineStyle = xlLineStyleNone Range(“B4:E4”).Borders(xlEdgeBottom).LineStyle = xlContinuous Range(“B5:E5”).Borders(xlEdgeBottom).LineStyle = xlDash Range(“B6:E6”).Borders(xlEdgeBottom).LineStyle = xlDashDot Range(“B7:E7”).Borders(xlEdgeBottom).LineStyle = xlDashDotDot Range(“B8:E8”).Borders(xlEdgeBottom).LineStyle = xlDot Range(“B9:E9”).Borders(xlEdgeBottom).LineStyle = xlDouble Range(“B10:E10”).Borders(xlEdgeBottom).LineStyle = xlSlantDashDot ActiveWindow.DisplayGridlines = False End Sub [/code]
セルの背景色を設定する
セルの背景色を設定する方法です。
■ コード内を「Wクリック」で選択できます。[code] Sub サンプル3444_3() Range(“B3:E3”).Select Selection.Interior.Color = RGB(144, 238, 144) End Sub [/code]
• Selection.Interior.Color = RGB(144, 238, 144)
’選択した背景をRGB関数でlightgreen(ライトグリーン)にします。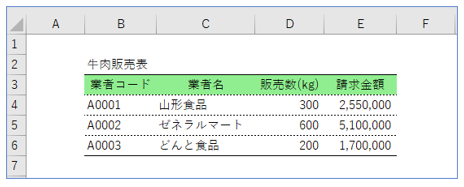
セルの文字色や背景色を設定するマクロ ことができます。
RGB関数の数値 は、色見本のサイトなどで知ることができます。
以上で「罫線を引くマクロ」の説明を終わります。